• Home
  • About
  • Resume
  • Portfolio
  • Services
  • Contact

Portfolio

A glimpse of the projects I've been working on


Dashboard for World Population 2021


Creation of a dashboard to explore the database of the world population.

Movies Industry Data Analysis and Visualizations


Creation of a notebook to explore the database from the Movie Industry.

Can we predict who would've survived the Titanic?


Creation of a notebook to predict who would've survived.

© Copyright ILHAM. All Rights Reserved

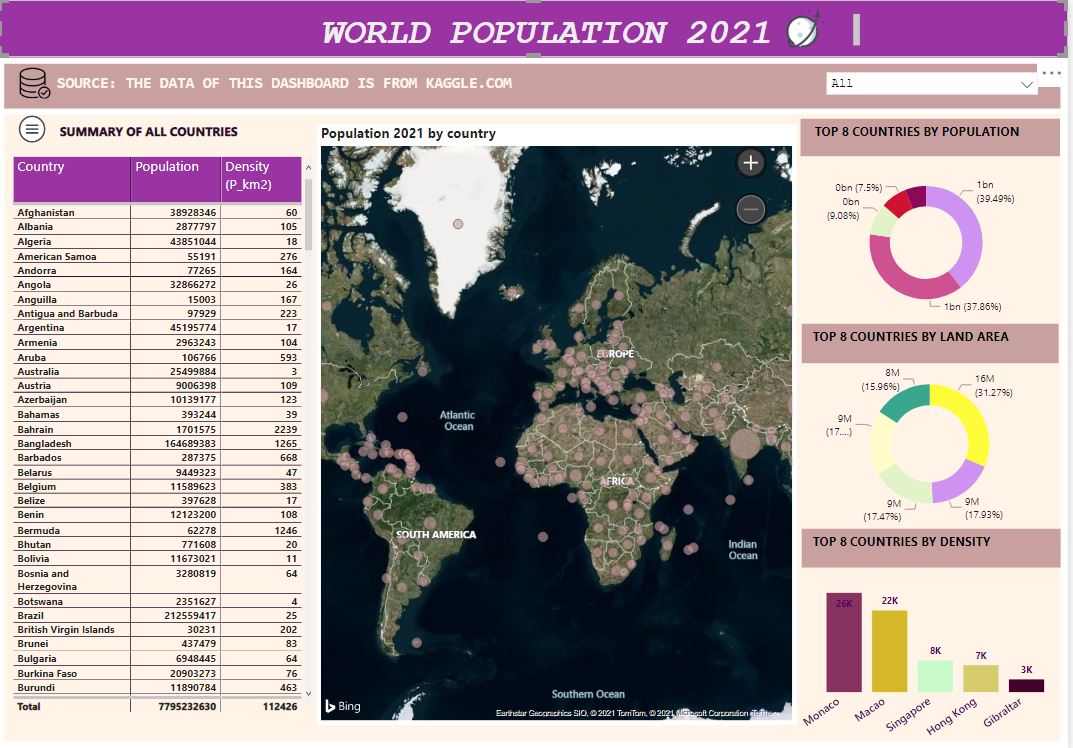
Dashboard for World Population 2021.


Description

Everyone at one time or another has wondered, how many are we in the world? Unfortunately, in our daily life we can know a very limited number of people, but precisely for this reason it is interesting to understand how many other people besides us live on this planet. But also, what are the largest countries in the world? And again, does the greater surface area mean that those countries are also the most populous or is there something else that affects the number of people present in a country? So with this Power BI Dashboard in here we will mainly analyze:

  • the population,
  • the extension of the countries,
  • the population density.

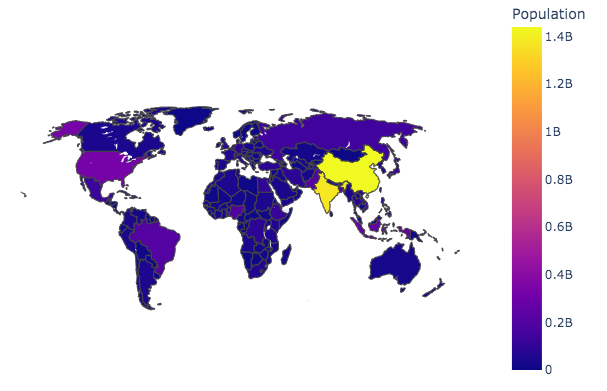
The dashboard was created using Power BI to create interactive graphs, and specific packages to interact with the database. Here is a screenshot of the dashboard.

Github

Movies Industry Data Analysis and Visualizations


Description

Is the movie industry dying? is Netflix the new entertainment king? Those were the first questions that lead me to analyze this dataset over the last decades.

Objectives: are one of the entertainment sources of our time. The history of the movie is century old. From the beginning to till date movies attract viewers all over the world. At present, all most each and every country has a movie industry. The project dataset contains the movie industry's data from 1986 to 2016.

this project we will be working in Python to firstly recognize, analyze our data using a wide variety of functions in the Pandas library and secondly find the correlations between variables.

Kaggle

Can we predict who would've survived the Titanic?


Description

RMS Titanic was a British passenger liner operated by the White Star Line that sank in the North Atlantic Ocean on 15 April 1912, after striking an iceberg during her maiden voyage from Southampton to New York City. Of the estimated 2,224 passengers and crew aboard, more than 1,500 died, making the sinking at the time one of the deadliest of a single ship. One of the reasons of that much of loss of life was that there were not enough lifeboats for the passengers and crew. Although there was some element of luck involved in surviving the sinking, some groups of people were more likely to survive than others, such as women, children, and the upper-class.

In this project we will be working in Python on the famous Titanic dataset to Predict if a passenger will survive the sinking or not?

This notebook will be presented in 5 Steps:

  • Collecting the data
  • Exploratory data analysis
  • Feature engineering
  • Modelling
  • Testing

kaggle